- Published on
Debug with browser DevTools in Server-side Node.js
- Authors
- Name


Easy steps so we can use debugger that you may not know. See below example with Next.js, chrome DevTools:
Steps
Run this script, we can run development with debugger attached.
NODE_OPTIONS='--inspect' next dev
You will see these outputs:
Debugger listening on ws://127.0.0.1:9229/e8290eb3-2965-4718-8fb9-d47b56c94b5c
For help, see: https://nodejs.org/en/docs/inspector
   the --inspect option was detected, the Next.js router server should be inspected at port 9229.
  ▲ Next.js 14.2.10
  - Local:        http://localhost:3000
  - Environments: .env.development.local, .env

 ✓ Starting...
   automatically enabled Fast Refresh for 1 custom loader
 ✓ Ready in 1626ms
 ○ Compiling /api/contributions ...
 ✓ Compiled /api/contributions in 1053ms (804 modules)
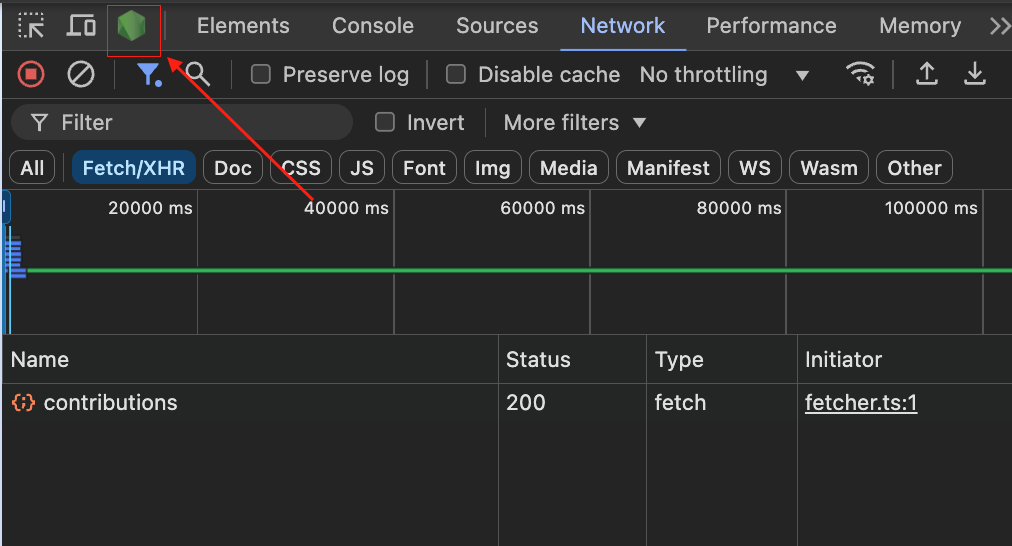
In your browser, open DevTools in chrome or microsoft edge, you will see this.
Just add a breakpoint or put debugger on any line.
Start to run something with server actions. In my example, i went to my home page with api route running.
Reference links you may need to know more.
Reach out with Steve's video Debugging in Node.js is SO much better with this one trick
Read more in Next.js original docs Debugging with Browser DevTools